Transforming and Graphing logarithmic functions
Graphing logarithmic functions
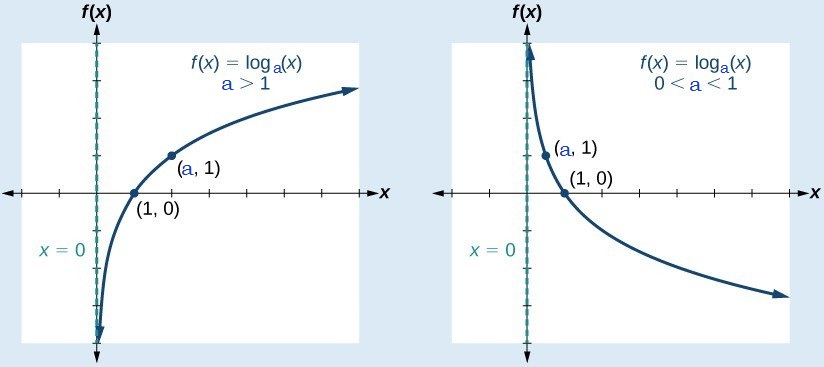
There are two possible cases of logarithmic function .
Case 1. When a>1
Then logarithmic function is increasing function with x intercept as (1,0).
Case 2. When 0<a<1
Then logarithmic function is decreasing function with x intercept same as (1,0).
Following graph will help you to observe the similarity and difference between two cases.
Transformation of log functions
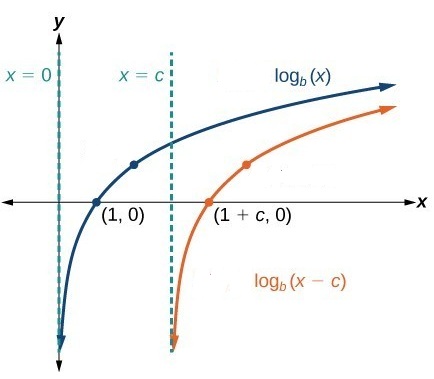
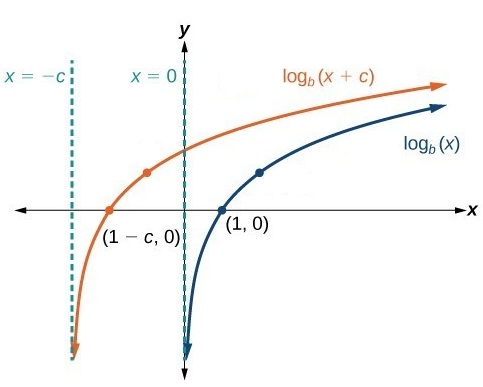
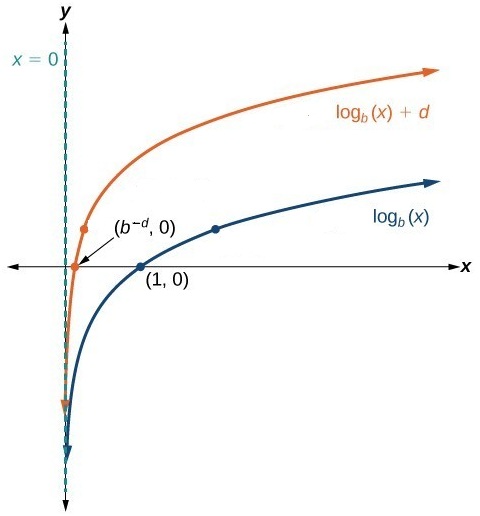
To graph log functions we need to understand the different transformations with respect to the parent log function .
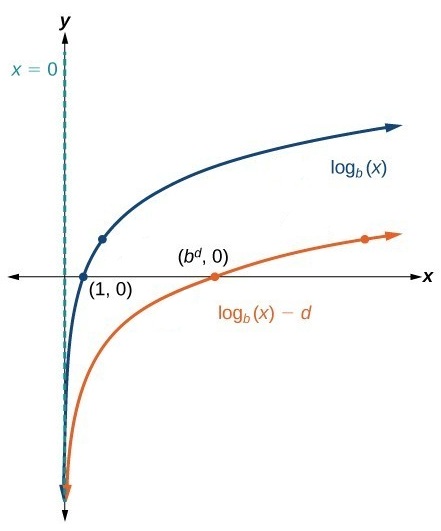
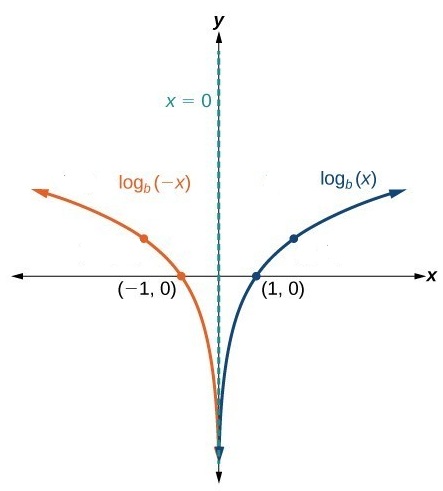
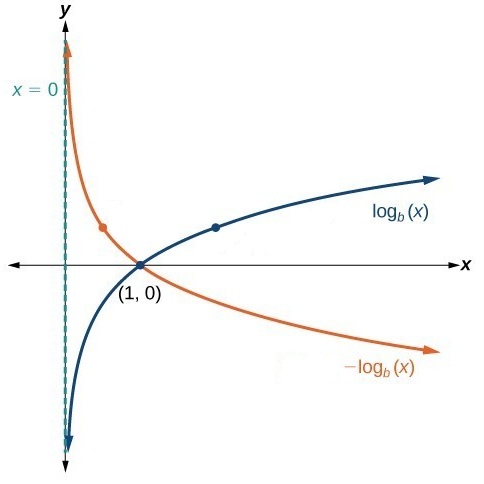
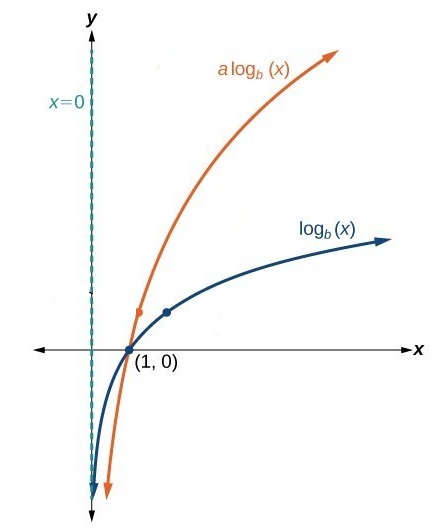
Here is a beautiful summary of all the transformations and the effect of these transformations on different parameters like domain, x-intercept, vertical asymptotes etc.
| Function f(x) | Transformation | V.A. | X -Intercept | Domain | Range |
| None | X=0 | (1,0) | (0, ∞) | (-∞,∞ ) | |
| Shift right | X=c | (1+c,0) | (c, ∞) | (-∞,∞) | |
| Shift left | X=-c | (1-c,0) | (-c,∞ ) | (-∞,∞) | |
| Shift up | X=0 | ( |
(0,∞ ) | (-∞,∞) | |
| Shift down | X=0 | ( |
(0, ∞) | (-∞,∞) | |
| Reflection across y axis | X=0 | (-1,0) | (-∞,0 ) | (-∞,∞) | |
| – |
Reflection across x axis | X=0 | (1,0) | (0,∞ ) | (-∞,∞) |
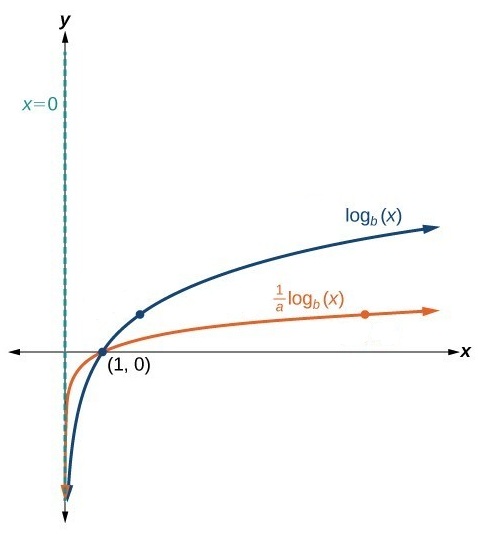
| Vertical stretch | X=0 | (1,0) | (0,∞ ) | (-∞,∞) | |
| Vertical compression | X=0 | (1,0) | (0, ∞) | (-∞,∞) | |
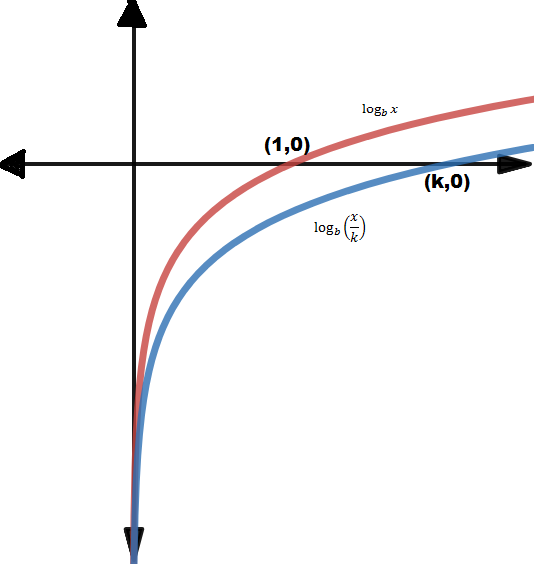
| Horizontal stretch | X=0 | (k,0) | (0, ∞) | (-∞,∞) | |
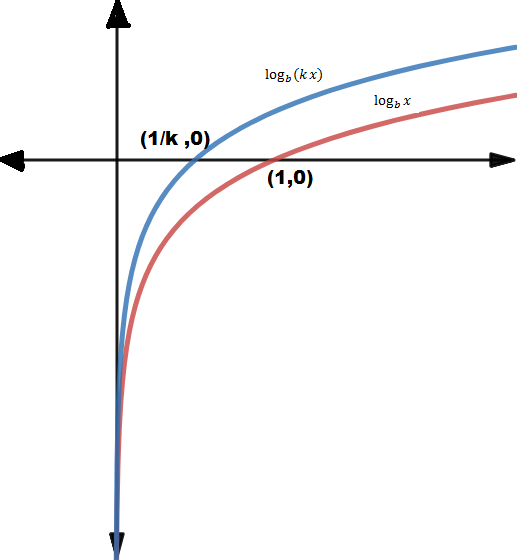
| Horizontal compression | X=0 | ( 1/k ,0) | (0,∞) | (-∞,∞) |
And their respective graphs are shown below:
| |
 |
| |
 |
| |
 |
| |
 |
| |
 |
| |
 |
|
|
 |
|
|
 |
|
|
 |
| |
 |
Lets work on an example of combined transformation.
Example1 : Sketch the graph of y=log(x-2)+3 and state its domain, range , x intercept and vertical asymptote.
Solution: For this graph two steps of transformations are used with respect to parent function graph.
Parent function y= log(x)
Step1. Shift the basic graph to right by 2 units
Y= log(x-2)
Step 2) then shift the graph up by 3 units
Y= log(x-2) + 3
And we get the graph as shown by blue graph below.
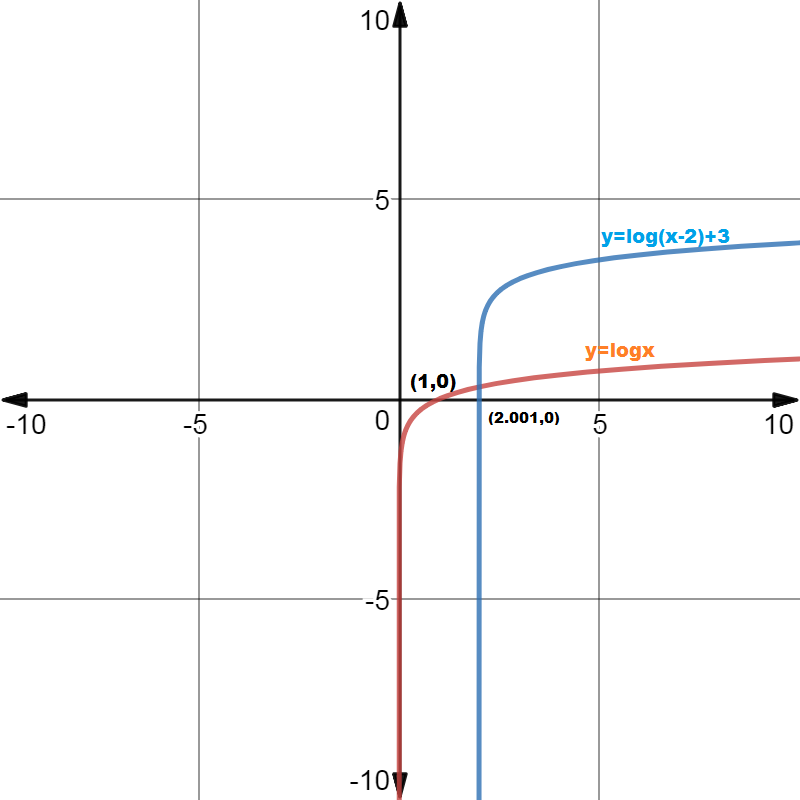
Domain: (2, )
Range: (- ,
)
Vertical asymptote : x=2
X intercept : =
Example2: Sketch the graph of y=2log(3-x)-1 and state its domain, range , x intercept and vertical asymptote. Analyze it for increasing and decreasing behavior, continuity , symmetry and end behavior.
Solution: Rewriting given function in standard form we get,
Y=2log(-(x-3))-1
Now we apply following procedure to get its graph from parent function y= logx
Step 1) Shift the graph to right by 3 units.
Y = log(x-3)
Step 2) Reflect the graph along y axis.
Y= log(-(x-3))
Step3) Stretch the graph vertically by 2 units.
Y = 2log(-(x-3))
Step 4) Shift the graph down by 1 unit.
Y = 2log(-(x-3))-1
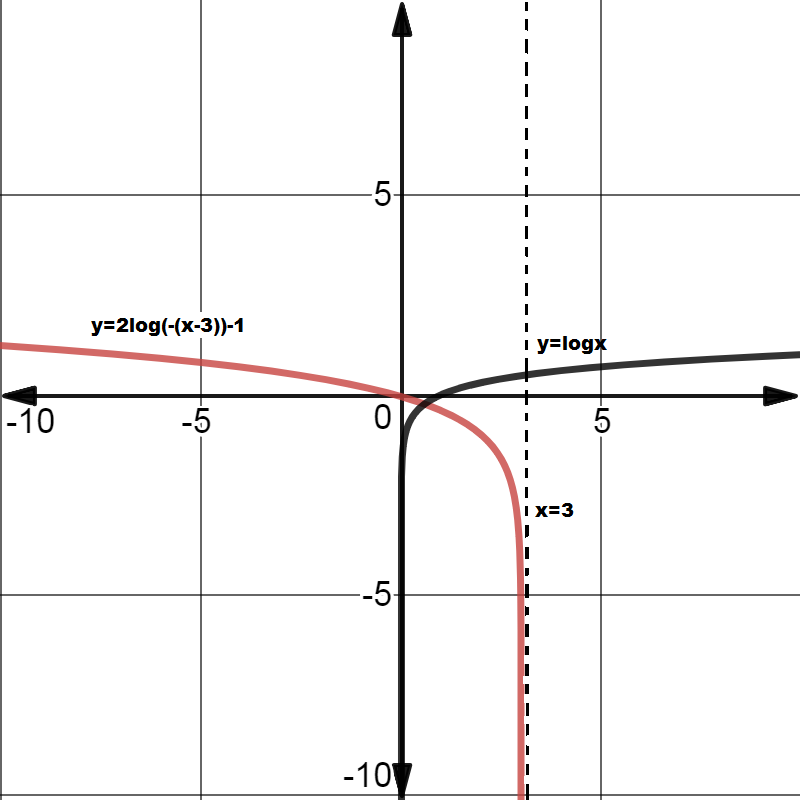
Decreasing everywhere.
Continuous in its domain (- ,3)
Not symmetric
End behavior: =
Practice problems:
Sketch the graph of following log functions and state their domain, range, asymptotes and intercepts if any.
- Y= ln(x) +2
- Y=log(x-3)
- Y=-3log(-x)
- Y=-3log(1-x)+1


